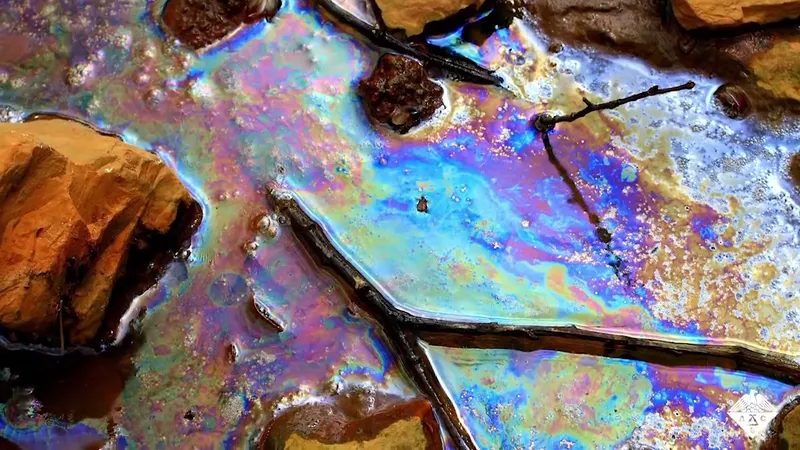
We tend to think of oil spills as cinematic disasters. A massive tanker splits open. Black sludge chokes the coastline. Birds collapse. It’s dramatic. It’s tragic. It’s easy to pin blame on a single captain or a single company. But the real problem isn’t just the spectacular wrecks. Those are rare now. Not because the risk vanished, but because regulations tightened. Shipping rules got stricter. Environmental checks are more rigorous. The era of the supertanker dumping its load in plain sight is largely over.
Yet the ocean is still drowning in petroleum. And not in the way most people imagine.
The public imagination is stuck in the 1960s. That’s when the scale of the problem exploded. Petroleum exploration moved onto continental shelves. Supertankers grew to monstrous sizes. Some could carry over 500,000 metric tons of crude. When one broke, it broke badly. The Torrey Canyon in 1967 shocked the world. It made oil pollution a headline issue. It forced governments to act. But the damage didn’t stop. It just changed form.
Today, thousands of minor spills happen annually. Several are major. They come from well discharges. They come from routine tanker operations. The total volume released each year exceeds one million metric tons. That’s not a typo. That’s a million tons. Added to that is the negligence of industries and individuals. Used gasoline solvents. Old crankcase lubricants. These get washed into drains. They seep into waterways. They don’t make the news. But they add up.
Combine that with natural seepage from the ocean floor. Oil leaks from the seabed naturally. Always has. That’s not human error. That’s geology. But when you stack natural leakage on top of human activity, the numbers get staggering. The total amount of oil entering the world’s waterways each year ranges from 3.5 to 6 million metric tons.
Which is worse? A single catastrophic spill or the slow, steady bleed?
The answer is both. And neither is getting easier.
The hidden cost of clean water
People ask how we can prevent oil spills. They want solutions. They want hope. But first, they need to understand the scale. One million tons is not an abstraction. It’s a physical reality. It coats rocks. It suffocates plankton. It enters the food chain. It ends up on dinner plates.
The 1960s were a turning point. Not because the oil disappeared. But because we finally saw it. We saw the birds. We saw the beaches. We saw the economic cost. We started to care. Care led to rules. Rules led to fewer supertanker disasters. But they didn’t lead to zero oil in the water.
The problem is diffuse. It’s systemic. It’s every drop of oil that ever touched a surface. From the offshore rig to the gas station. From the industrial plant to the driveway. It’s all connected. The ocean doesn’t distinguish between a tanker wreck and a leaky engine. It just takes the oil.
And it keeps taking it.
Every year.
The Hidden Price of a Spill
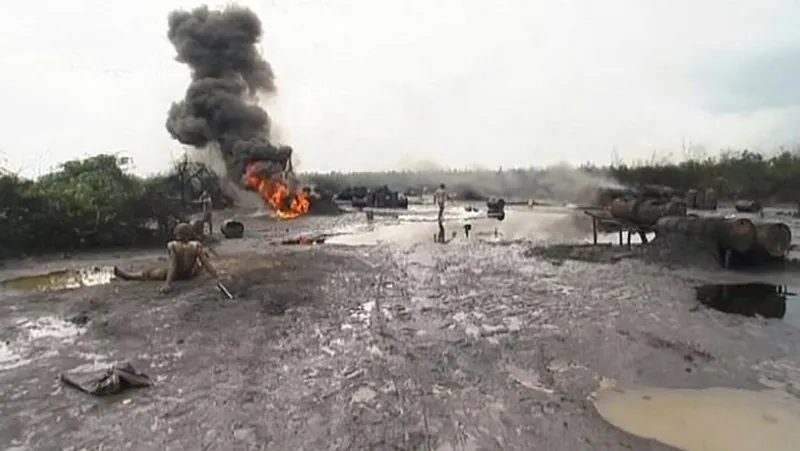
The financial and ecological bill for an oil spill is staggering. It’s not just about the black sludge on the surface. It’s about what that sludge does to the water itself.
Sunlight can’t penetrate the slick. Photosynthesis stalls. Dissolved oxygen levels plummet. The water becomes a dead zone before the oil is even fully accounted for.
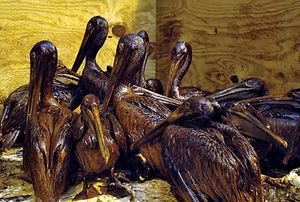
Then there’s the wildlife. Birds and marine mammals rely on their feathers and fur for insulation. Oil destroys that waterproofing. They don’t just get dirty. They freeze. Hypothermia sets in quickly.
And ingestion is worse. Toxic compounds enter the food chain. Habitat damage lingers. Reproductive rates drop. Populations don’t bounce back after a spill. They shrink. Or vanish.
Saltwater marshes take a hit. Mangroves suffer. These shore ecosystems are fragile. Once coated, they struggle to recover.
Tourism tanks. Commerce stalls. Power plants that pull in seawater for cooling shut down. Utilities that discharge into the sea halt operations.
Fishing is hardest hit. Commercial fishing stops immediately. Not just to protect equipment. To stop contaminated catch from hitting the market.
Long-Term Recovery vs. Immediate Fallout
The short-term damage is visible. The long-term damage is buried in sediment and tissue.
Animals don’t just die. They fail to reproduce. Generations are lost. Recovery isn’t linear. It’s slow. Often incomplete.
Beaches aren’t just sand. They’re economic engines. Fouled shores mean empty hotels. Closed restaurants. Lost jobs.
The industry most affected? Fishing. Suspensions last months. Sometimes years. Markets lose confidence. Prices spike. Consumers stay away.
Oil spills aren’t accidents. They’re catastrophes with ripple effects that span oceans and economies. The cost isn’t measured in barrels alone. It’s measured in lives. Lost. Both human and animal.
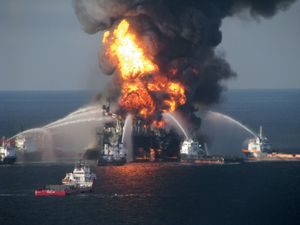
We know what an oil spill looks like in the immediate aftermath. The slicks. The dead birds. The panic. But the long-term ecological scar? That’s harder to pin down. It lingers. And the financial hit to communities and individuals has become a blunt but effective incentive for the industry to try harder, to do better, to prevent the next catastrophe.
Prevention is the goal. But when prevention fails, the cleanup begins.
No silver bullet for the slick
Despite decades of high-profile disasters, there is no single, thoroughly satisfactory method for wiping the ocean clean of a major spill. The tech has improved. The coordination is tighter. But the fundamental problem remains: water and oil don’t mix, and separating them at scale is brutal.
The strategy is usually pragmatic. Contain it. Remove enough of it so the economy can breathe again. Then let nature finish the job. Natural recovery processes are slow, but they are real.
Containment and removal in calm waters
Booms are the first line of defense. Floating barriers placed around the source or at the mouth of harbors. They don’t remove the oil. They just stop it from spreading further. Simple physics. Effective if the water is calm.
Skimming follows. Like booms, this works best when the sea is flat. Mechanisms physically lift the oil-water mixture, separate the two, and pump the oil into storage tanks. It’s mechanical. It’s labor-intensive. It fails when the waves get rough.
Then there are sorbents. Materials designed to soak up the hydrocarbon. Straw. Volcanic ash. Polyester plastic shavings. They act like sponges for the spill. You spread them, they absorb, you collect them. It’s messy. It creates a secondary waste problem. But it works in specific conditions.
Chemical aids and beach battles
Chemical surfactants and solvents offer another route. Spread over a slick, they accelerate natural dispersion. They break the oil down, helping it mix with the water and dilute. It’s controversial. It speeds up the process, but it changes the toxicity profile. The oil isn’t gone. It’s just more dispersed.
On shore, it’s worse.
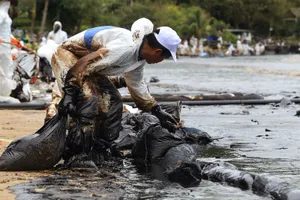
When oil penetrates sandy beaches or coats rocky shores, the cleanup becomes a war of attrition. Small armies of workers. Hand tools. Heavy construction equipment. Scraping. Hauling. It’s laborious. It’s expensive. It’s traumatic for the landscape.
“Responses to oil spills seek to contain the oil and remove enough of it so that economic activity can resume and the natural recovery processes of the marine environment can take over.”
The technology exists. The management has evolved. But the ocean is vast. The oil is tenacious. And the cost—financial, environmental, human—remains the only thing that consistently drives the needle toward prevention.
We keep building better booms. Better skimmers. Better sorbents. But until we stop spilling, the cleanup will always be a reaction. Never a solution.
The sheer scale of maritime disasters often dwarfs their local impact. While the Exxon Valdez is seared into the public memory for its ecological devastation in Alaska’s Prince William Sound, it barely scratches the surface when measured against the largest oil-tanker spills in history. That 1989 disaster released 37,000 metric tons of crude oil. It was a tragedy. It was also modest in comparison to the titans that came before it.
Two events in European waters fundamentally changed how the world handles shipping and pollution. The Torrey Canyon wrecked off Cornwall in 1967, dumping 119,000 metric tons of crude. Then came the Amoco Cadiz off Brittany in 1978, losing 223,000 metric tons. These weren’t just accidents. They were catalysts. They forced a reckoning with the regulatory gaps in maritime safety and emergency response.
But if you look strictly at volume, the biggest spills were often geographically isolated. Or they happened in places where nature did the cleanup for us.
The top five worst oil spills by volume
The International Tanker Owners Pollution Federation tracks these rankings. The data is stark. It shows a clear distinction between ecological catastrophe and massive, yet contained, loss of cargo.
-
Atlantic Empress (1979): This was the biggest. 287,000 metric tons of crude oil. The ship collided with another tanker and caught fire. It was towed 300 nautical miles out to sea before sinking. The entire load was lost. Yet, reports indicated only minor ecological damage to island coastlines. The distance from land saved the ecosystem, not the ship.
-
ABT Summer (1991): Off Angola, southwestern Africa, this vessel lost 260,000 metric tons. It caught fire, sank, and took five crewmen with it. No ecological damage was reported. The open ocean absorbed the spill.
-
Castillo de Bellver (1983): Near Saldanha Bay, South Africa, this ship broke in two and burned. 252,000 metric tons of crude spilled. Winds and currents dispersed the oil. Wildlife damage was minor. The sea itself was the primary buffer.
-
Amoco Cadiz (1978): Here, location changed everything. 223,000 metric tons spilled. Steering failure grounded the ship on French shores. It broke apart. Contamination stretched over 300 km of Breton coastline. Tens of thousands of birds and marine animals died. Thousands of workers cleaned marshes and beaches. It remains one of the largest responses in history.
-
Haven (1991): Genoa, Italy. 144,000 metric tons. The ship burned and broke apart. Some oil was recovered at sea. But 100 km of coastline in Italy and France required mechanical cleaning. The impact was regional, not just localized.
Why location matters more than volume
The difference between the Atlantic Empress and the Amoco Cadiz is geography. Both lost over 200,000 metric tons. One was an open-ocean loss. The other was a coastal disaster.
This distinction drives policy. It explains why regulations tightened after the 1970s. It wasn’t just about how much oil a ship could carry. It was about what happens when that oil hits land.
The Torrey Canyon spill highlighted the dangers of chemical dispersants. In an attempt to break up the slick, officials used powerful solvents. They later proved to be more harmful to the environment than the crude oil itself. This lesson is still relevant today. It forces responders to weigh short-term visibility against long-term toxicity.
Notable spills that didn’t make the top five
The gap between the Amoco Cadiz and the next major events is wide. But the following spills had significant consequences, often due to proximity to sensitive areas or human error.
- Odyssey (1988): 132,000 metric tons. Broke in two in the Atlantic, far from Nova Scotia. No ecological damage reported. The distance was the only factor.
- Sea Star (1972): 115,000 metric tons. Collided with another tanker in the Gulf of Oman. Burned and sank. 12 crew lost. No ecological damage.
- Irenes Serenade (1980): 100,000 metric tons. Caught fire while refueling in Greece. Some oil was salvaged. Some drifted ashore, requiring hundreds of workers to clean it up.
- Urquiola (1976): 100,000 metric tons. Ran aground in port in Spain. The captain was lost. Chemicals were used to disperse the oil. Much of the nearby coastline remained coated in debris and oil.
- Hawaiian Patriot (1977): 95,000 metric tons. Cracked in a storm. Burned and sank 300 nautical miles from Honolulu. Currents dissipated the oil.
The human cost and the cleanup
Rankings based on metric tons ignore the human toll. The ABT Summer took five lives. The Sea Star took twelve. The Independenţa (1979) lost 43 crew members near Istanbul. The Urquiola lost its captain. The Jakob Maersk (1975) lost seven.
And the cleanup? It is often manual. Brutal. Long-lasting.
The Braer (1993) lost 85,000 metric tons off the Shetland Islands. High seas dispersed most of the fuel. But salmon farms suffered massive losses. The economic impact rippled through local communities long after the visible oil was gone.
The Khark 5 (1989) spilled 80,000 metric tons off Morocco. One-quarter of its load hit the water. Wind and waves dispersed most of it. But some reached beaches near Casablanca. Workers cleaned it up by hand.
What this means for modern shipping
The data from these spills tells a simple story. Technology helps. Tankers are built better now. Double hulls are standard. But the risk remains.
The Aegean Sea (1992) grounded in rough weather near La Coruña. It broke in two. 74,000 metric tons spilled. Wave action dispersed part of it. But 300 km of shoreline was polluted. Fisheries were suspended.
Why do these old spills still matter? They shaped the laws we follow today. They defined the protocols for emergency response. They taught us that volume isn’t the only metric for disaster.
Proximity to population centers. Sensitivity of local ecosystems. The effectiveness of cleanup methods. These are the variables that determine the true cost of a spill.
The Exxon Valdez changed public perception. The Torrey Canyon and Amoco Cadiz changed the law. The Atlantic Empress and ABT Summer remind us that the ocean can absorb a lot. But it has limits.
We track these numbers to prevent recurrence. To improve safety. To mitigate damage. But the question isn’t just how much oil spills. It’s what we do with it when it hits the shore. The answers to that question are written in the coastlines of Brittany, Cornwall, and beyond.
The Scale of Catastrophe: When Tankers Go Wrong
The list of major maritime oil spills isn’t just a roster of names and dates. It’s a record of how close we came to ecological disaster, and how often we were forced to clean up the mess. Look at number 17.
Sea Empress. 1996. Milford Haven, Wales.
A 72,000-ton tanker. It grounded while entering port. Half its crude oil load spilled out before the ship was even refloated. Sounds bad, right? But here’s the thing about crude oil: it’s volatile. A lot of that spill just evaporated. Some dispersed into the water column. Some was actually recovered from the surface. The cleanup effort was frantic but effective. Workers tackled 200 kilometers of polluted shoreline. It was a disaster, but it wasn’t the end of the world for the Welsh coast.
Then you jump back to 1985.
Nova. Off Kharg Island, Gulf of Iran.
70,000 tons spilled. No details on the cleanup here. Just the number. The Gulf of Iran is a sensitive place. The politics there are messy. The ecology is strained. You don’t need a full report to know that 70,000 tons of oil doesn’t just disappear. It sits there. It coats rocks. It sinks into sediment. It waits.
By 1992, the Katina P was near Maputo, Mozambique.
66,700 tons. A storm damaged the hull. Grounded just offshore. Fuel oil leaked out through a hole in the side. The sea took most of it. It dispersed. But the mangroves? They didn’t get off so easy. Mangroves are filters. They trap pollutants. Cleaning that shoreline wasn’t just about skimming oil off the top. It was manual labor. Hands in the mud. Scrubbing roots. It takes a long time for a mangrove to recover from fuel oil exposure.
And then there’s the Prestige.
- Off Galicia, Spain.
This one still feels fresh. 63,000 tons. Severe weather wrecked the hull. Instead of staying put, the ship was towed 130 nautical miles out to sea. Why? Probably to keep it from breaking apart on the rocks immediately. But then it sank.
Heavy fuel oil spilled. This isn’t light crude. It’s thick. It doesn’t evaporate quickly. It doesn’t disperse easily. It sinks. It coats. It chokes.
The response was coordinated. Tracks were maintained. Recovery operations worked at sea. But the coastlines of northern Spain and western France were still coated in black sludge. You can track a spill. You can recover tons of it. But once it hits the sand, once it gets into the feathers of a cormorant, the math changes. The recovery effort is impressive. It’s also incomplete.
We keep seeing these numbers. 72,000. 70,000. 66,700. 63,000.
They look similar. But the impact depends on where the oil lands. And what’s already